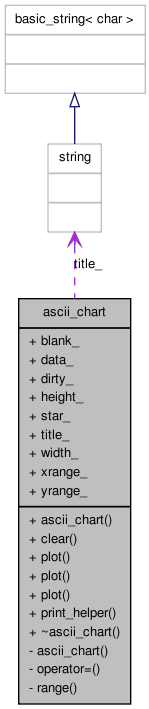
ascii_chart Struct Reference
An ascii_chart is a block of characters which contains a picture of a set of x,y pairs. The idea is that you use the plot() methods to fill the chart with spaces and stars representing data set. More...
#include <ascii_chart.h>
Public Types | |
| typedef std::vector< point_t > | data_t |
| actual representation of input data. | |
| typedef std::pair< X_t, Y_t > | point_t |
| actual representation of data points. | |
| typedef double | X_t |
| actual implementation representation of X's | |
| typedef double | Y_t |
| representation of Y's | |
Public Member Functions | |
| ascii_chart (int width, int height, char blank=' ', char star='*') | |
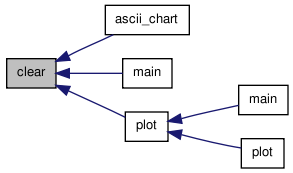
| void | clear () |
| set back to all blanks. | |
| template<class Container > | |
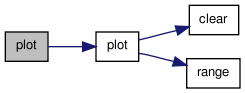
| void | plot (Container const &c) |
| Given some general container, copy it to a vector then plot it. | |
| template<class X , class Y > | |
| void | plot (std::vector< std::pair< X, Y > > const &data) |
| Template version of the plot method to reduce the need for user's copying their data into the standard form. | |
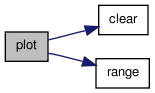
| void | plot (data_t const &data, int xola=0) |
| This function creates an ascii plot of the data stored in the input vector. That is, it fills an 'ascii_chart' with spaces and stars that represent the input data. | |
| void | print_helper (std::ostream &stream) const |
| ~ascii_chart () | |
Public Attributes | |
| char | blank_ |
| char representing empty | |
| char ** | data_ |
| a variable length array of null terminated strings data_ contains height+1 rows of data. The last pointer stored there is null so you can check for it when iterating if you like. data_[0] refers to the highest Y value. data_[height-1] is the lowest y value. | |
| bool | dirty_ |
| ie not clean. set by plot, cleared by clean | |
| int | height_ |
| number of rows found at data_; | |
| char | star_ |
| char representing data here | |
| std::string | title_ |
| The title of this chart. | |
| int | width_ |
| number of columns in each row in data_ | |
| std::pair< X_t, X_t > | xrange_ |
| A range of X values. | |
| std::pair< Y_t, Y_t > | yrange_ |
| A range of Y values. | |
Private Member Functions | |
| ascii_chart (ascii_chart const &) | |
| ascii_chart & | operator= (ascii_chart const &) |
| void | range (data_t const &data) |
| compute ranges | |
Friends | |
| std::ostream & | operator<< (std::ostream &s, ascii_chart const &a) |
Detailed Description
An ascii_chart is a block of characters which contains a picture of a set of x,y pairs. The idea is that you use the plot() methods to fill the chart with spaces and stars representing data set.
You can write the chart to an ostream or manually print it in some other way.
The un-adorned data of the chart can be accessed using the public variable data_. See member print_helper() to understand how to print the chart yourself.
The method plot() allows you to convert an array of x,y pairs into a chart. You can then print the rows of text yourself -- they are null terminated. You must add needed annotations. The plot method gives you the min and max range of the input data for this purpose.
The variable title_ holds a string which will be displayed centered above the chart when using operator<<. Annotations of the max and min of the x and y range will be produced by operator<<.
Example:
- See also:
- chart_test.c
Definition at line 43 of file ascii_chart.h.
Member Typedef Documentation
actual representation of input data.
Definition at line 71 of file ascii_chart.h.
actual representation of data points.
Definition at line 70 of file ascii_chart.h.
| typedef double X_t |
actual implementation representation of X's
Definition at line 67 of file ascii_chart.h.
| typedef double Y_t |
representation of Y's
Definition at line 68 of file ascii_chart.h.
Constructor & Destructor Documentation
| ascii_chart | ( | int | width, | |
| int | height, | |||
| char | blank = ' ', |
|||
| char | star = '*' | |||
| ) |
fill the data_ array with height rows of width character slots. Actually width+1 slots -- the last one has 0. The data_ array actually has height+1 slots -- the last is null. Clears the chart too.
Definition at line 21 of file ascii_chart.cxx.

| ~ascii_chart | ( | ) |
Definition at line 51 of file ascii_chart.cxx.
| ascii_chart | ( | ascii_chart const & | ) | [private] |
Member Function Documentation
| void clear | ( | ) |
set back to all blanks.
Fill the chart with spaces
Definition at line 67 of file ascii_chart.cxx.
| ascii_chart& operator= | ( | ascii_chart const & | ) | [private] |
| void plot | ( | Container const & | c | ) |
Given some general container, copy it to a vector then plot it.
- Parameters:
-
c the container of x/y pairs to plot
Definition at line 145 of file ascii_chart.h.
| void plot | ( | std::vector< std::pair< X, Y > > const & | data | ) |
Template version of the plot method to reduce the need for user's copying their data into the standard form.
- Parameters:
-
data the data to be plotted.
Definition at line 117 of file ascii_chart.h.

| void plot | ( | data_t const & | data, | |
| int | xola = 0 | |||
| ) |
This function creates an ascii plot of the data stored in the input vector. That is, it fills an 'ascii_chart' with spaces and stars that represent the input data.
The data is scaled to fit into the ascii_chart's width and height. No annotations are added. Put them in yourself when you print the chart.
- Parameters:
-
data the data to plot xola ignore this paramer -- its existence is internal to the class' implementation details.
Definition at line 140 of file ascii_chart.cxx.

| void print_helper | ( | std::ostream & | stream | ) | const |

| void range | ( | data_t const & | data | ) | [private] |
compute ranges
Definition at line 91 of file ascii_chart.cxx.
Friends And Related Function Documentation
| std::ostream& operator<< | ( | std::ostream & | s, | |
| ascii_chart const & | a | |||
| ) | [friend] |
Definition at line 173 of file ascii_chart.h.
Member Data Documentation
| char blank_ |
char representing empty
Definition at line 85 of file ascii_chart.h.
| char** data_ |
a variable length array of null terminated strings data_ contains height+1 rows of data. The last pointer stored there is null so you can check for it when iterating if you like. data_[0] refers to the highest Y value. data_[height-1] is the lowest y value.
Definition at line 79 of file ascii_chart.h.
| bool dirty_ |
ie not clean. set by plot, cleared by clean
Definition at line 77 of file ascii_chart.h.
| int height_ |
number of rows found at data_;
Definition at line 75 of file ascii_chart.h.
| char star_ |
char representing data here
Definition at line 86 of file ascii_chart.h.
| std::string title_ |
The title of this chart.
Definition at line 91 of file ascii_chart.h.
| int width_ |
number of columns in each row in data_
Definition at line 74 of file ascii_chart.h.
A range of X values.
Definition at line 88 of file ascii_chart.h.
A range of Y values.
Definition at line 89 of file ascii_chart.h.
The documentation for this struct was generated from the following files:
- include/cxxtls/ascii_chart.h
- lib/ascii_chart.cxx